
From the rack to the AI, one continuous chain.
Sensors, gateways and analytics, one platform.
End-to-end monitoring: IoT sensors, edge gateways, data normalization and AI analytics on a single platform for complete infrastructure visibility.
- Physical sensing
- Data acquisition
- AI analytics
- One platform
Sense
Field sensors
Acquire
Edge gateways
Normalize
One data model
Insight
AI analytics
One platform owns every layer, no vendor handoffs
One continuous chain
From the rack to the AI, one continuous chain.
Most monitoring stops at one layer. Prochista runs the whole chain: the sensor in the field, the gateway that collects it, and the AI that makes sense of it.
Physical sensing
Industrial sensors capture temperature, power, environment and equipment health right where it happens.
- Temperature
- Power
- Environment
Data acquisition
Gateways and DAQ nodes collect, timestamp and normalise readings, then forward them securely.
- Collect
- Timestamp
- Normalize
AI analytics
ProDCIM turns the stream into insight: dashboards, thresholds, anomaly detection and forecasts.
- Dashboards
- Anomaly
- Forecast
No integration seams between sensing and insight.
Because Prochista owns every layer, data flows from the sensor to the screen without a single handoff to engineer.
3 layers
One platform
Real-time
Sensor to screen
Zero
Integration seams
24/7
Continuous monitoring
Capabilities
One unbroken pipeline, end to end.
Unified visibility
Every site, device and metric on one NOC dashboard, no tool-hopping.
Real-time stream
Live readings from the field to the control room with sub-minute latency.
Anomaly detection
AI flags drift and outliers before they turn into incidents.
Trends & forecasts
Historical analytics and capacity forecasting built into the platform.
Smart alerting
Threshold and rule-based alerts routed to the right team, every time.
Secure by design
Encrypted transport, deployed on-prem or cloud, your data stays yours.
How it works
Four stages, one unbroken pipeline.
The same path for every reading: measured in the field, surfaced as insight in the control room.
1. Measure
Field sensors read the physical world continuously and reliably.
2. Acquire
Gateways collect, timestamp and buffer every reading at the edge.
3. Normalize
Data is cleaned, unified into a common model and stored.
4. Insight
AI analytics surface what matters, on the dashboard and in alerts.
On the platform
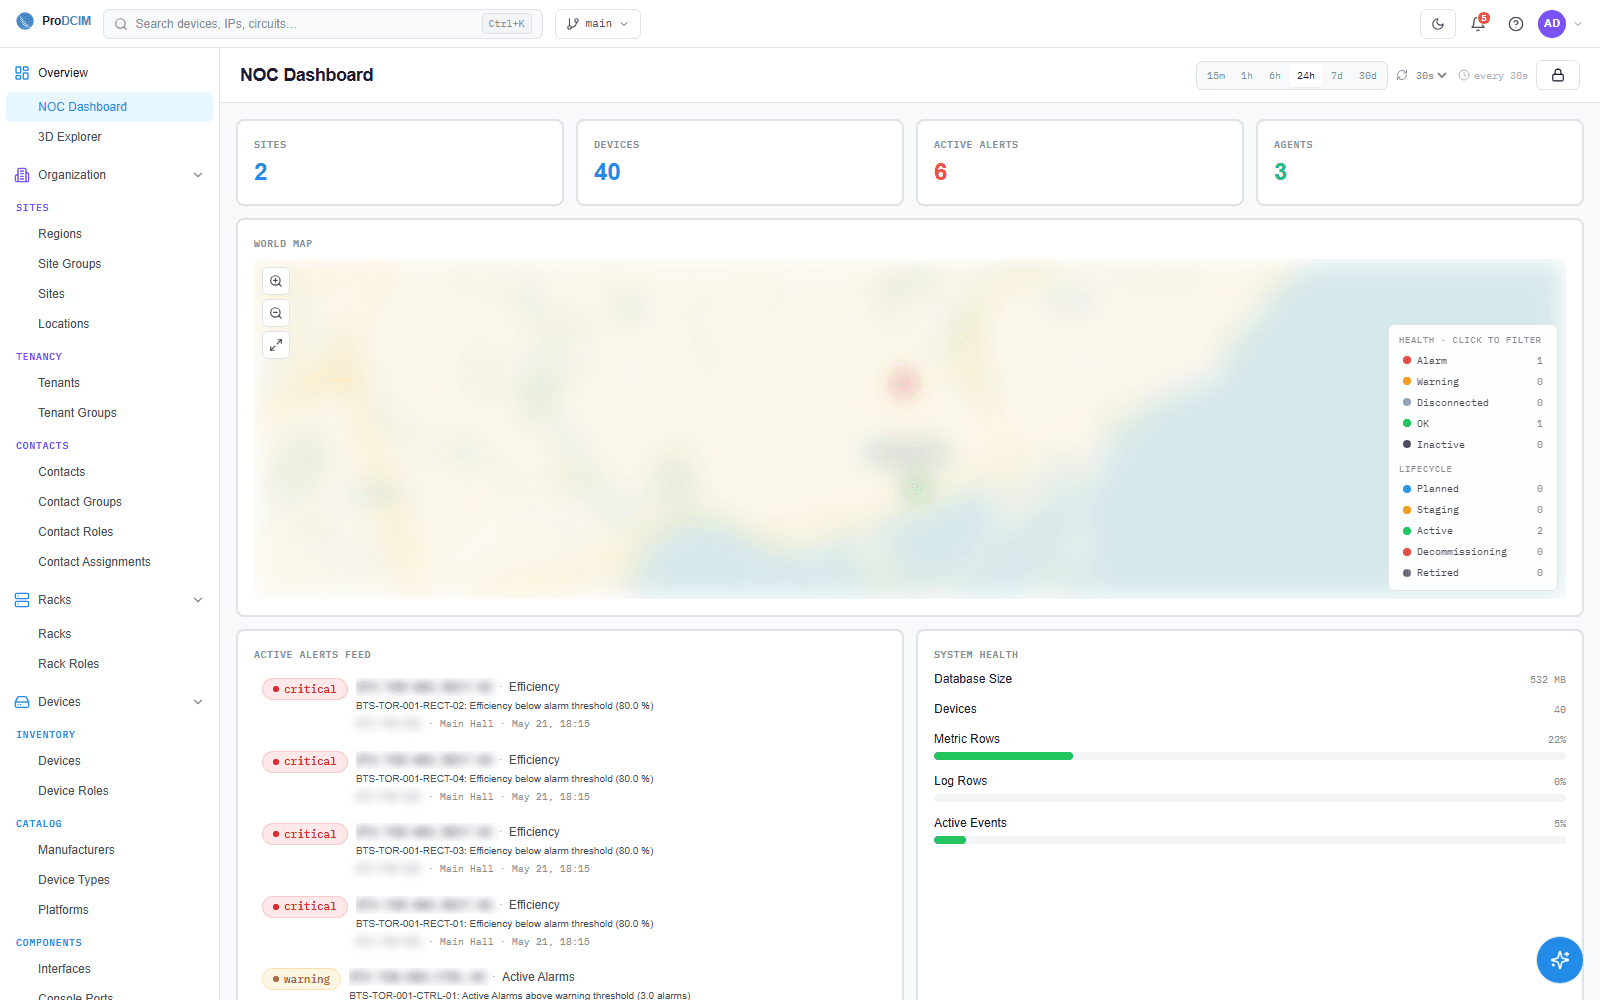
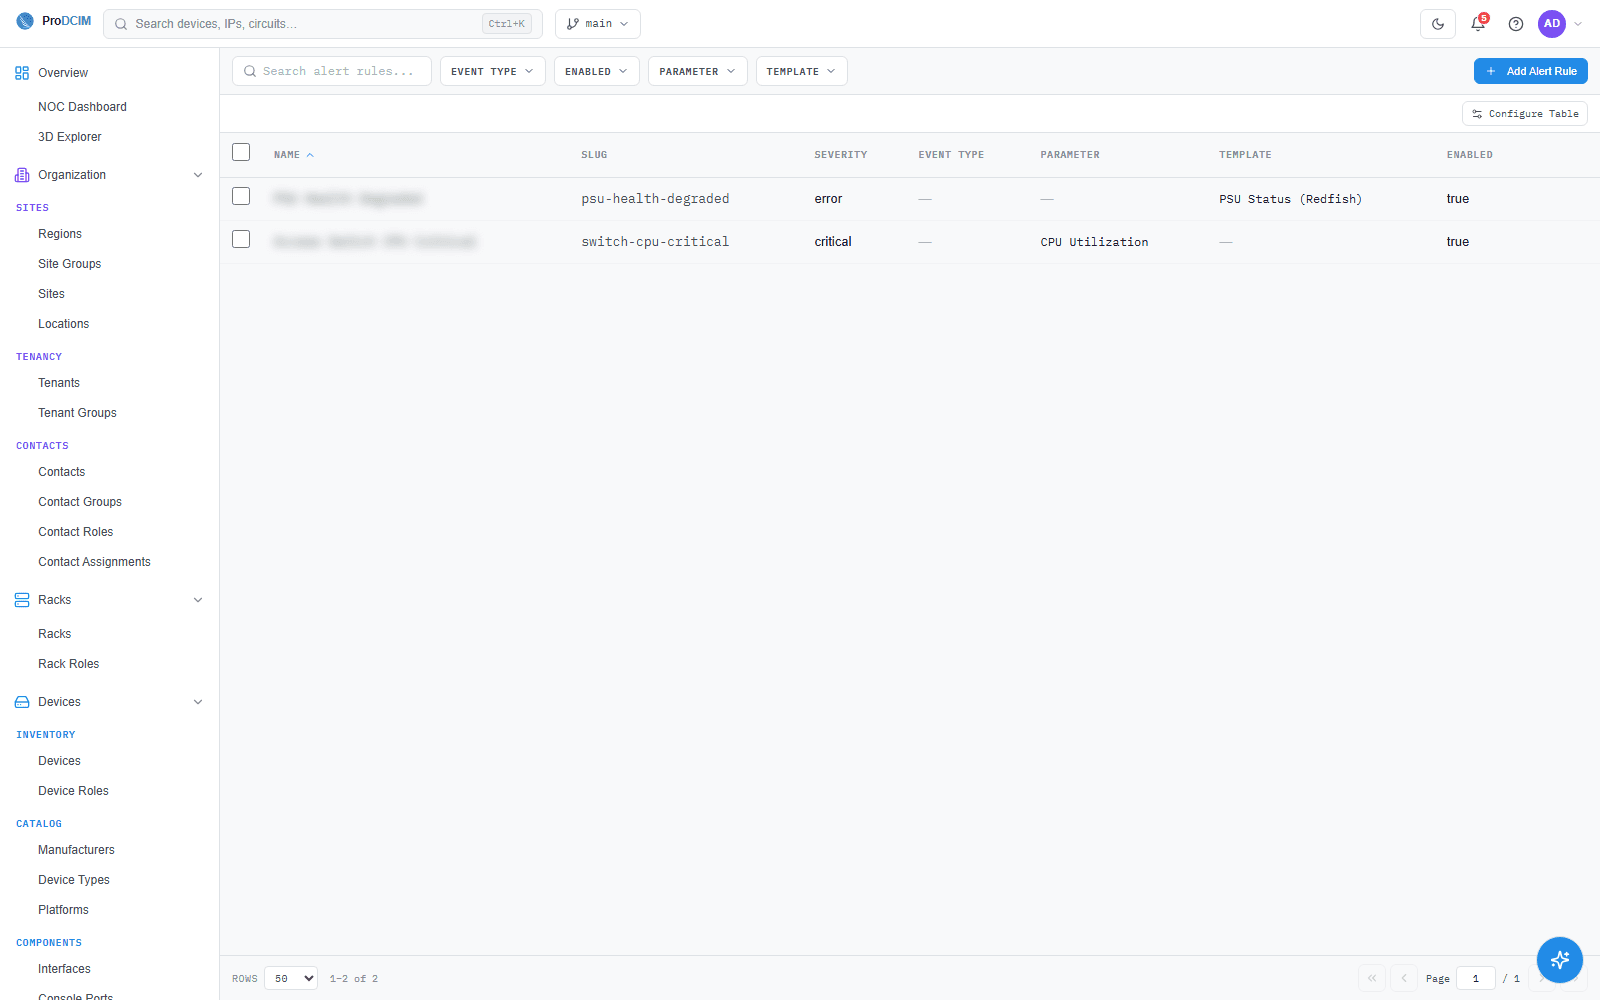
One screen for the whole chain.
Sample platform data shown.
Part of the platform
Better together, on one platform.
Explore at your own pace
Not ready for a demo? Take the next step.
See the whole chain on your infrastructure
Book a walkthrough and we'll map your sensors, sites and analytics into one platform.