
From fragmented infrastructure signals to one command center.
One live model. Zero blind spots.
ProDCIM unifies power, cooling, environment, network and assets into a single live operating picture, so you can act before issues become incidents.
- Asset visibility
- 2D / 3D
- Power & cooling
- Alarms
- On-prem or cloud
The problem
Signals everywhere, answers nowhere.
Power, cooling, environment, network and assets each live in their own tool. Teams stitch the picture together by hand, and find out about problems late.
- Separate dashboards per system, no single view
- Reactive operations driven by phone calls, not alerts
- Capacity changes become guesswork
Separate systems, no single view
The command center
Every signal converges into one live model.
Power, cooling, network, sensors, assets and BMS, normalized and fused into a single operating picture your team works from.
ProDCIM
core
Six signal sources, one unified model
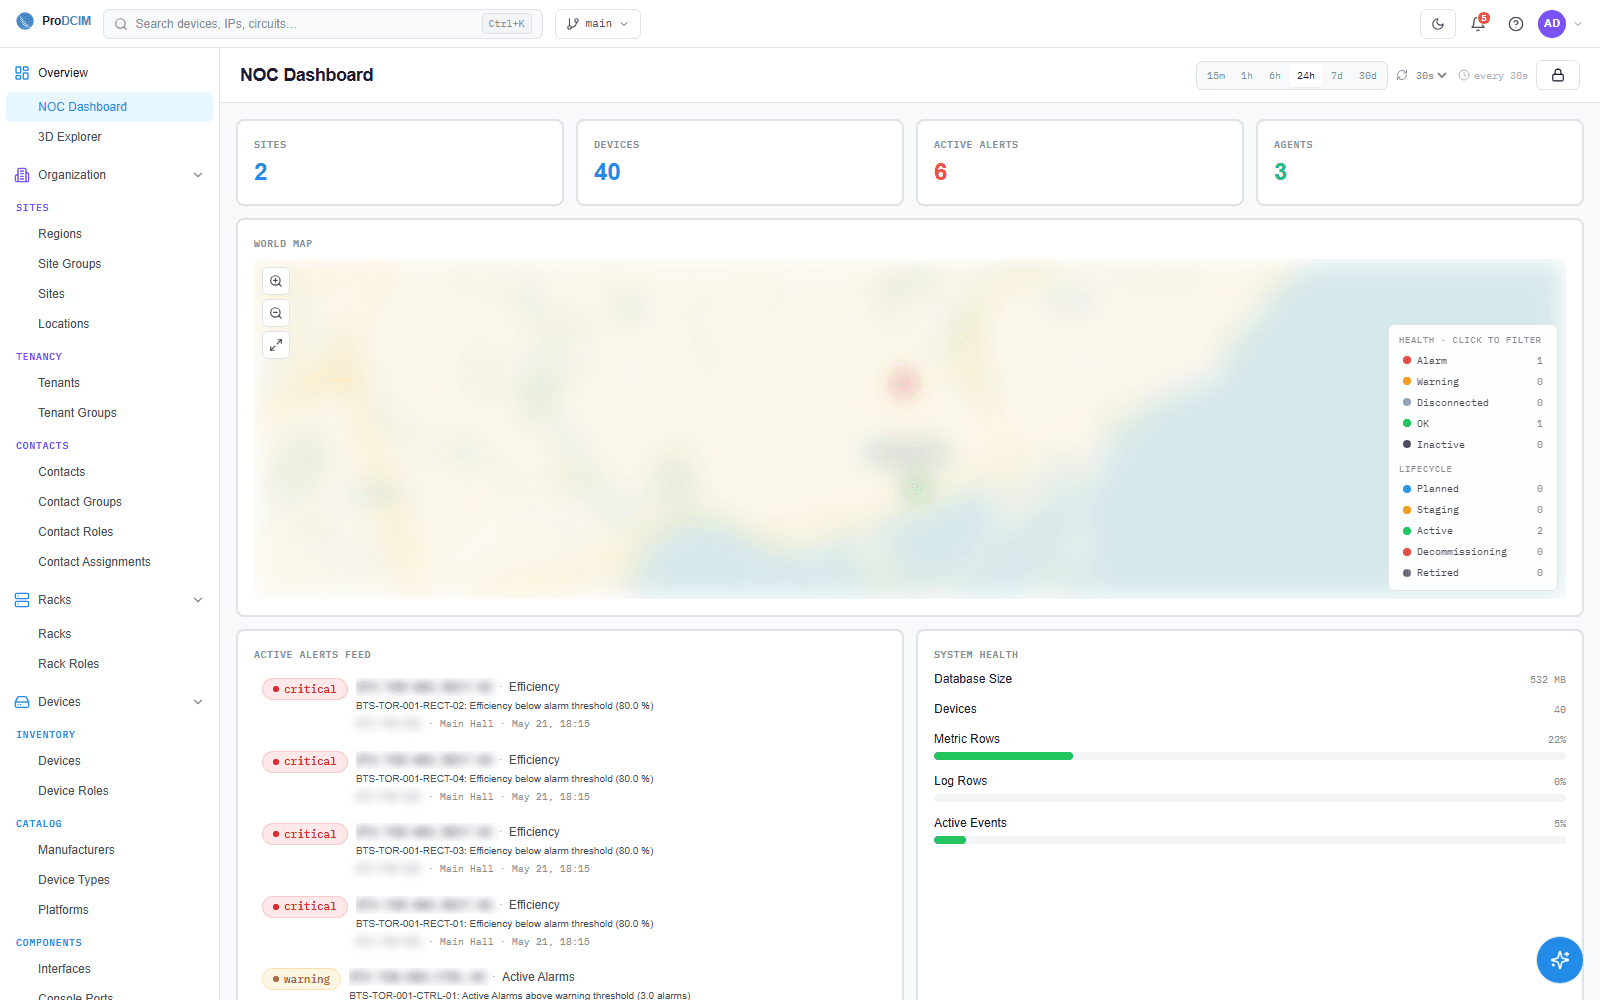
What this helps you do: see every site, alarm and health metric in one place, instead of a wall of separate consoles. Sample data shown.
What you can do
A complete DCIM toolkit, in one model.
Asset visibility
A unified asset database with auto-discovery, every device tracked by role, status and health.
2D & 3D visualization
Interactive floor plans and rack elevations that mirror the real facility, front and rear.
Power & energy
Feeds, panels and circuits with supply, voltage and current, down to the outlet.
Cooling & environment
Temperature, humidity and thermal utilization correlated with the assets they protect.
Alarm management
Rules on real parameters (PSU, CPU, thermal) with intelligent correlation to cut noise.
Structured cabling
Label, type and trace every cable and pathway, from patch panel to device port.
Capacity & reports
Space, power and thermal headroom and utilization analytics for confident planning.
How it works
Discover, connect, visualize, monitor, act.
1. Discover
Auto-discover sites, racks, devices and circuits.
2. Connect
Ingest signals over open industrial protocols.
3. Visualize
See it in 2D/3D and a unified live model.
4. Monitor
Watch power, cooling, network and assets in real time.
5. Act
Alert, plan capacity and resolve before impact.
See it in action
Real screens, real operators.
Sample data shown.
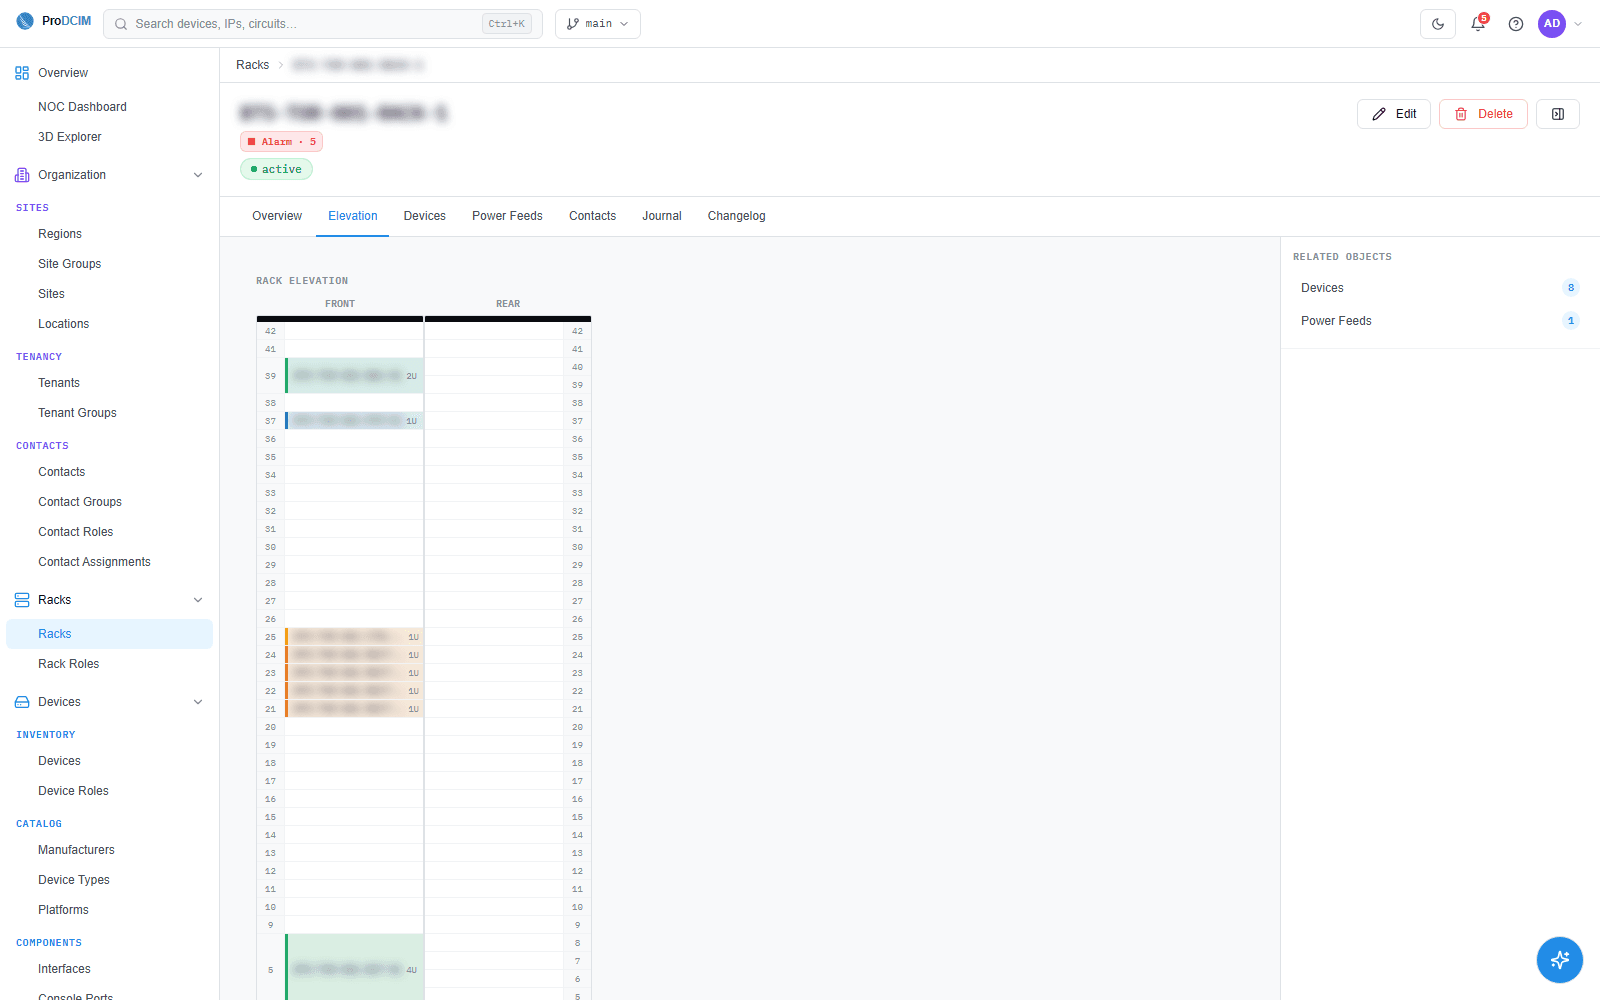
Visualize the floor. Front and rear rack elevations that mirror the real room, so you place and trace equipment with confidence.
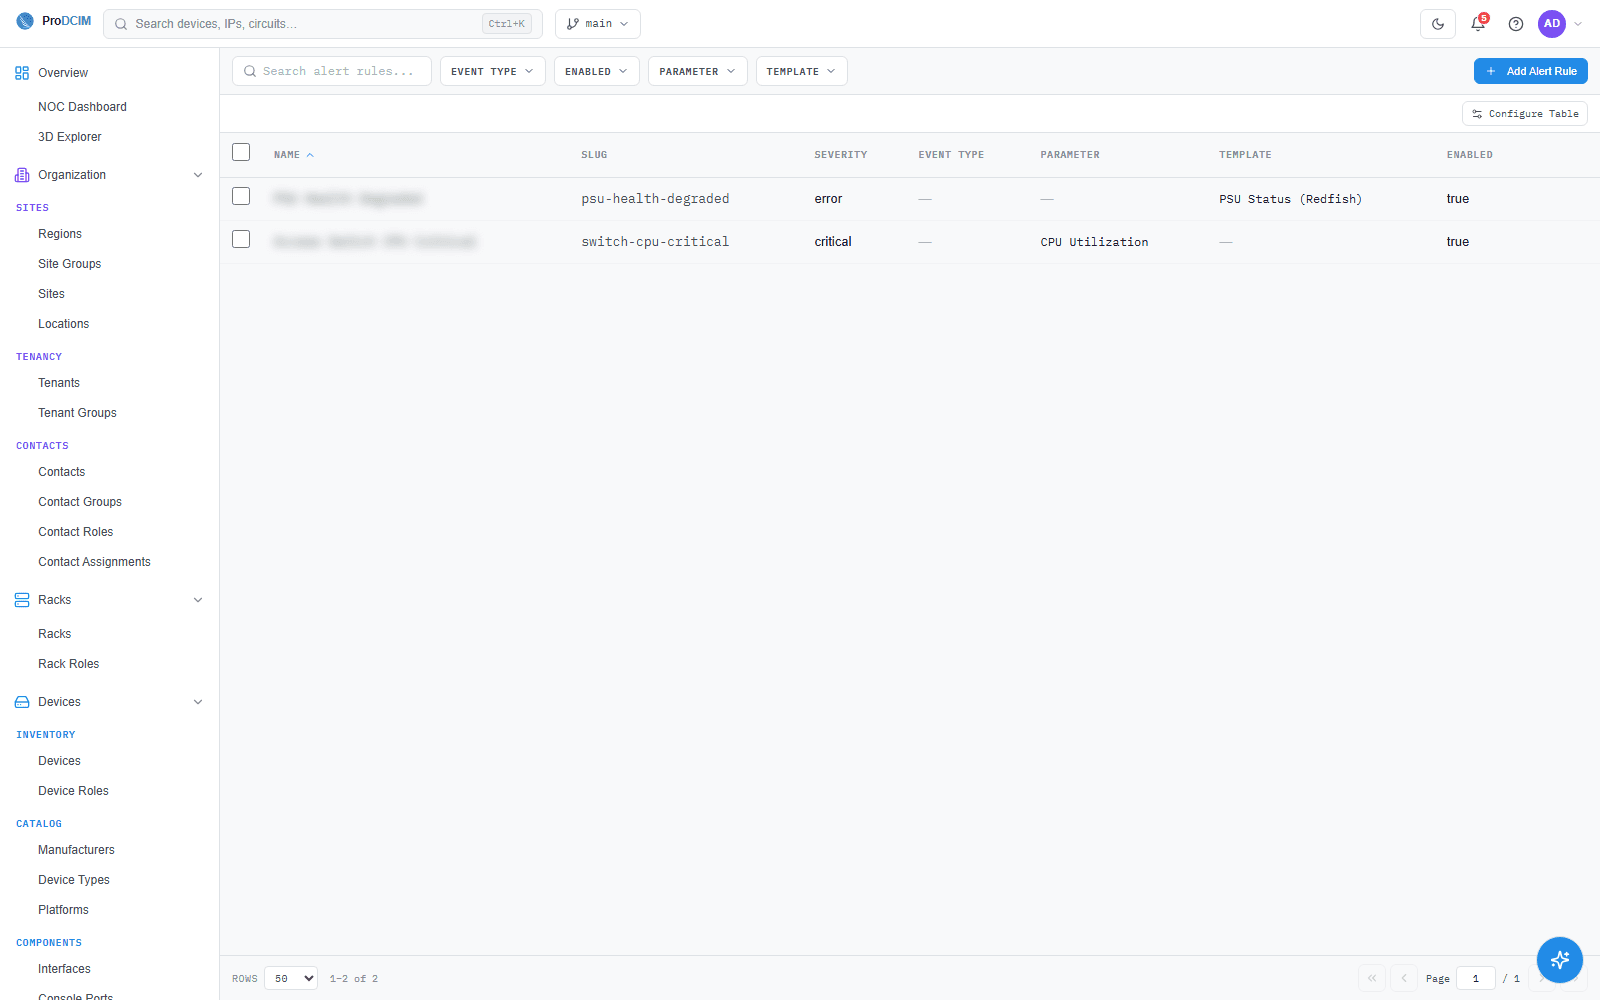
Catch issues early. Alert rules on real parameters (PSU, CPU, thermal) surface the right alarm at the right moment.
Open by design
Connects to what you already run.
Vendor-agnostic data acquisition over open industrial protocols, with deployment models that fit regulated and air-gapped environments.
SOC 2 Type II audited · on-prem, edge or secure cloud
ProDCIM
data layer
Built for critical environments
Where teams run ProDCIM
Data centres
Enterprise and hyperscale facilities and distributed data rooms.
Telecom / BTS
Remote network sites and base stations with secure, low-bandwidth links.
Distributed sites
Many geographically dispersed facilities, normalized into one view.
Critical facilities
Environments where uptime and reliability are non-negotiable.
The ecosystem
ProDCIM at the center of Prochista.
All connected through the same unified model and data layer.
Explore at your own pace
Not ready for a demo? Take the next step.
FAQ
Frequently asked questions
The questions buyers ask most when evaluating ProDCIM for critical infrastructure.
Does ProDCIM work in air-gapped environments?
What protocols and equipment does ProDCIM support?
How is ProDCIM different from a traditional BMS?
Is customer data ever sent to third-party AI APIs?
Is Prochista SOC 2 audited?
Can ProDCIM integrate with my existing and legacy equipment?
See ProDCIM on your infrastructure
Book a tailored walkthrough and we'll map ProDCIM to your sites, assets and monitoring needs.
Want a recommended profile first? Plan your deployment in about a minute.